|
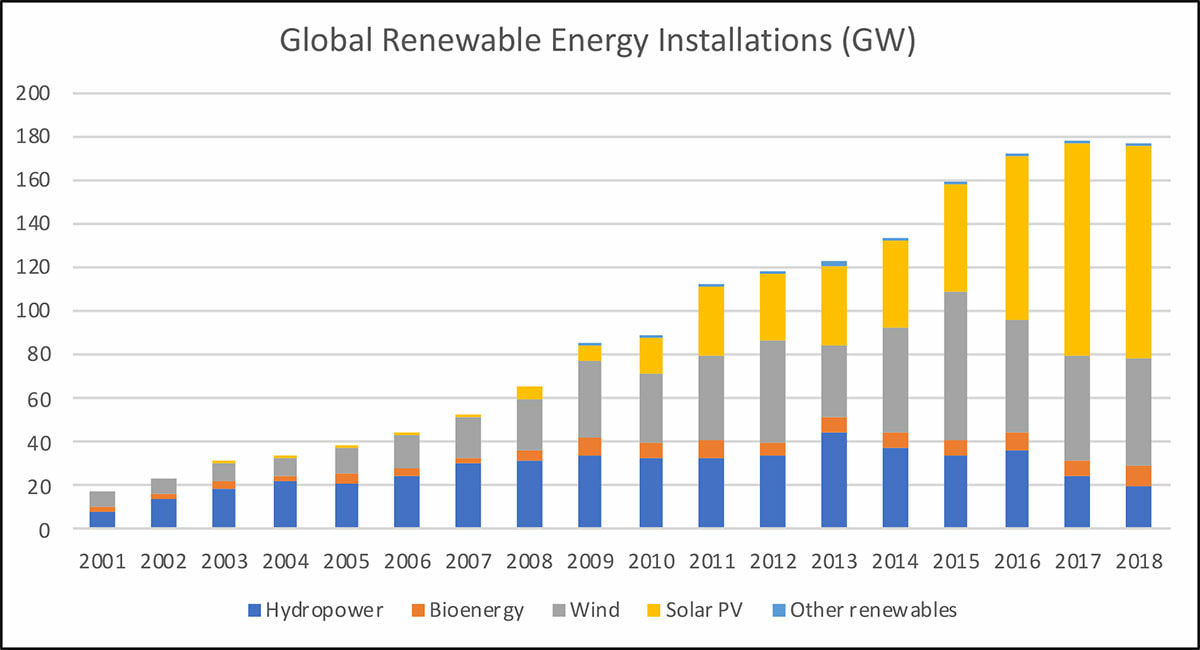
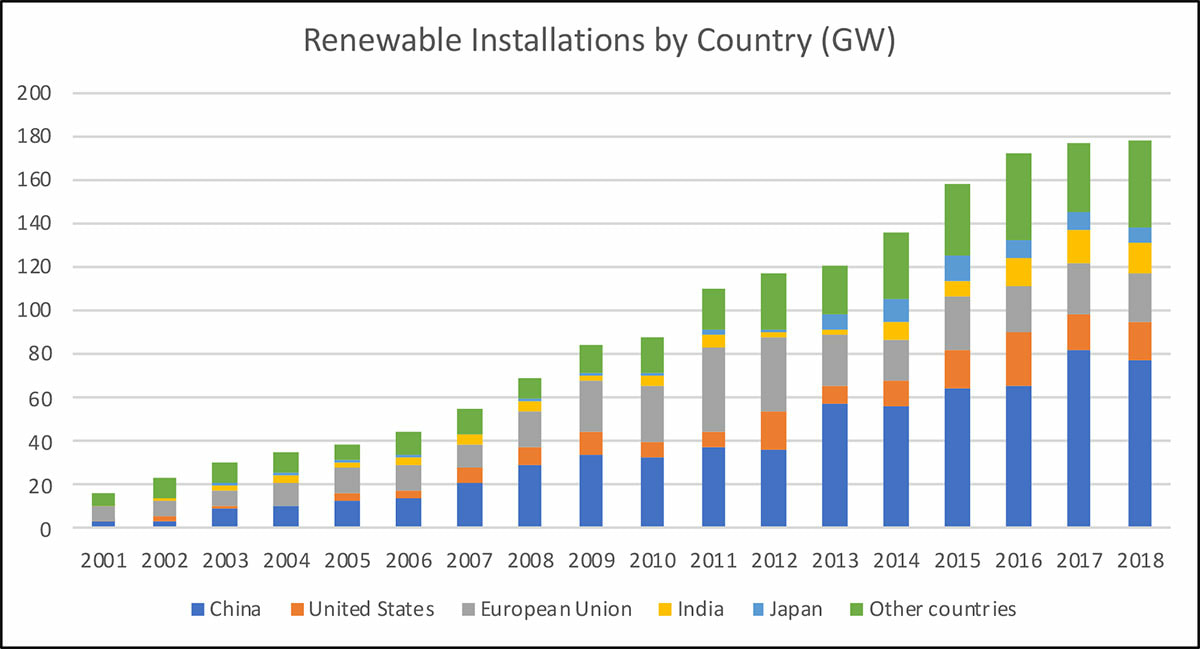
The global total of renewable energy installations plateaued for the first time in nearly 20 years, in 2018 (IEA), prompting calls for improved policies and financing solutions. Global renewable energy installation in 2018 was 177 GW, roughly the same amount of capacity as was added in 2017. This marks the first year since at least 2001 that year on year growth has not occurred. Figure 1 shows overall growth in renewable development since 2001, segmented by technology. Figure 1 (Data Source: IEA) The primary reason for the growth rate slowdown was a change in incentives for solar PV development in China. Last year, China sought to curb costs and focus on grid integration in an effort to sustain long-term solar PV expansion. In 2018 China added 44 GW of solar PV, compared with 53 GW the year before. After China, lower wind additions in the E.U. and in India also contributed to the slowdown. The U.S. increased net capacity marginally, from 17 GW to 18 GW, mainly through the addition of onshore wind. Figure 2 shows global renewable net capacity additions, segmented by country. (IEA 2019) Figure 2 (Data Source: IEA) Policy instruments can be employed to reinvigorate the upward trend in capacity, but financing availability and incentives can also play a big role. Financial and fiscal incentives can be used to improve access to capital, lower financing costs, and reduce construction costs. The incentives can take the form of tax breaks, rebates, grants, performance-based incentives, concessional loans, guarantees, and risk mitigation. Tax credits and capital subsidies have been applied with especially helpful results.
Of the available tax credits, a production or energy credit is often seen as the most effective. This is in contrast to the most popular tax tool which is a reduction in sales or energy taxes. However, a drawback to this type approach is the difficulty in designing mechanisms that specifically promote renewable energy. Instead, production tax credits, based on energy produced, and investment credits, based on up-front costs, are often seen as a more effective alternative. Production and investment tax credits have been especially instrumental in both wind and solar development in the U.S. The allowance of accelerated depreciation, whereby the cost of the facility is counted against taxable income more heavily during early years of operation, has also been beneficially applied. (IRENA 2019) Capital subsidies can be helpful in creating a level playing field with incumbent technologies. The subsidies can target specific technologies and work best when the qualifications are highly specific. This approach is most often used in countries at early stages of new-technology integration, after which performance-based subsidies might take over. As an interesting case study, Nepal offered capital subsidies in 2013 for projects up to 1 MW depending on the technology and location of facility (as an incentive to supply remote areas). The subsidy covered 40% of the capital cost, a soft loan covered an additional 40% and the developer was responsible for the final 20%. (IRENA 2019) More financial incentives will be required to achieve long-term climate goals; current power additions are only 60% of what’s required. According to the IEA, renewable capacity growth should be more than 300 GW annually, through 2030, to reach international goals. Currently, the energy industry is losing ground; last year, energy-related CO2 emissions rose by 1.7%, despite growth of 7% in generation from renewables. (Utility Dive) Increased availability of flexible financing (from both government and the private sector), along with fiscal incentives may be critical, to re-energize growth.
0 Comments
Leave a Reply. |
Richard Swanson, Ph.D.Asset valuation and project finance expert, specializing in financial and economic analysis of civil infrastructure assets. Archives
June 2022
Categories |


 RSS Feed
